Boundary Analytics
- 2025 Communication Arts Award
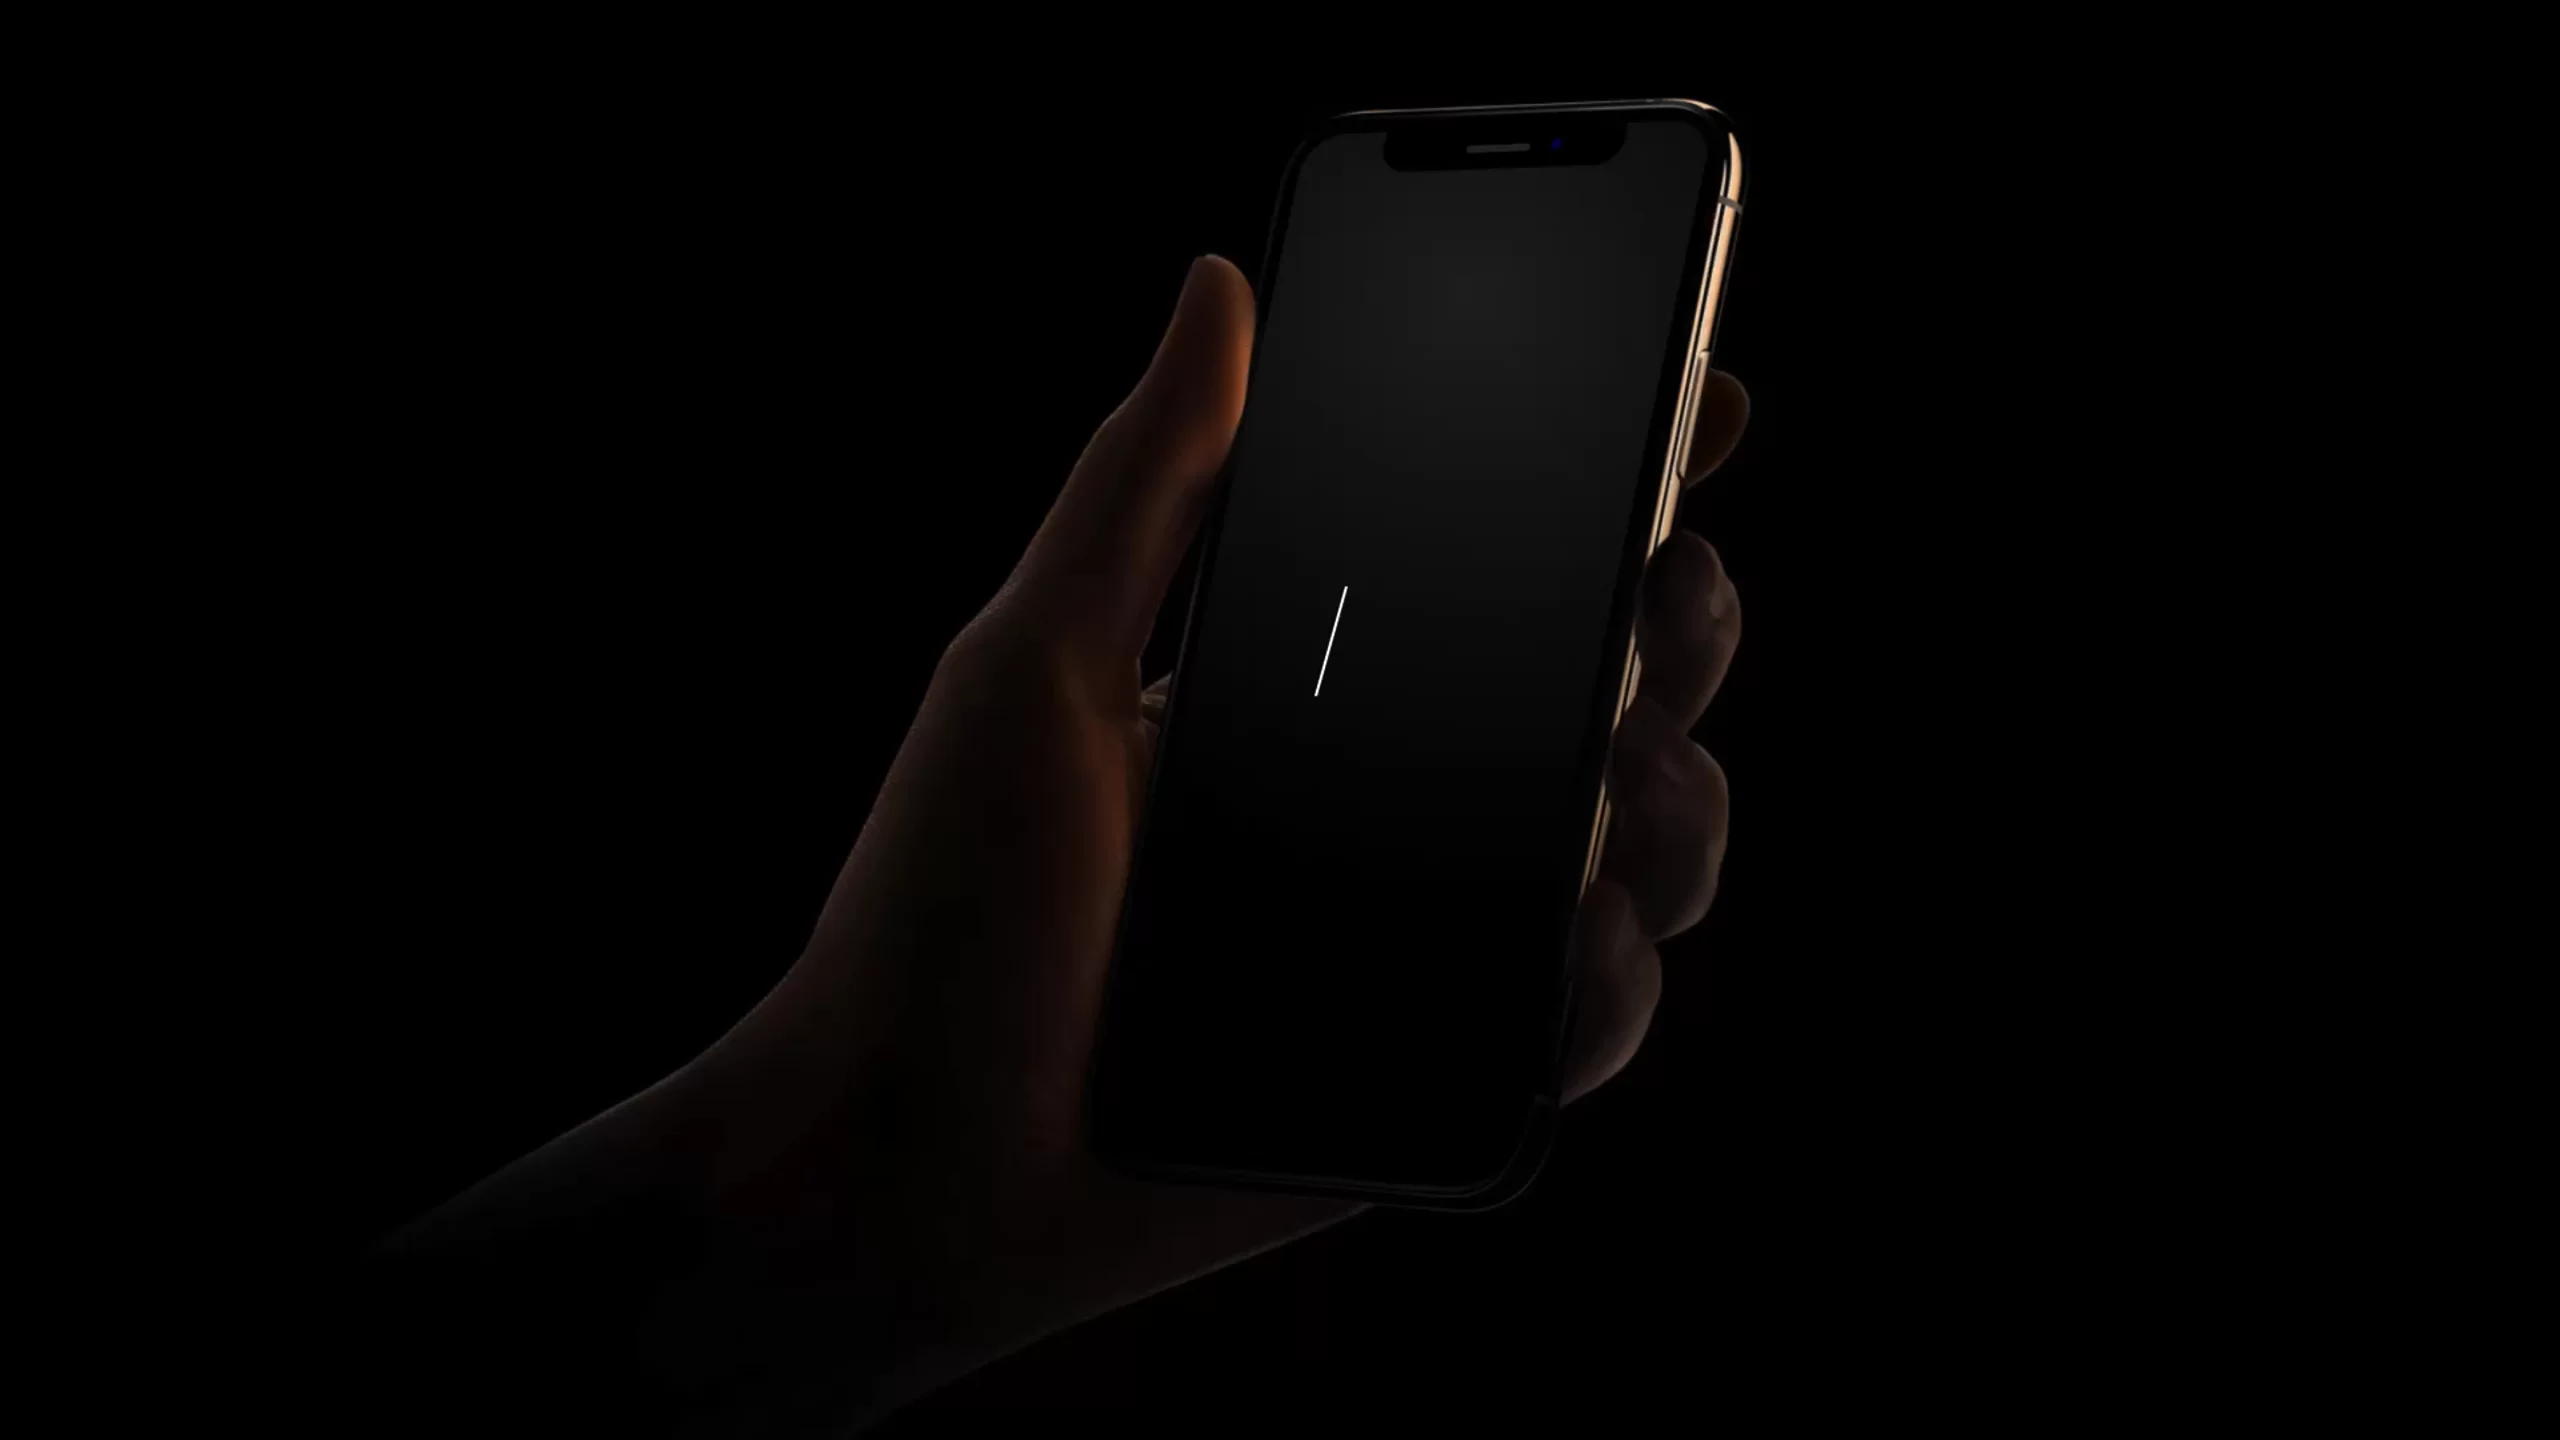
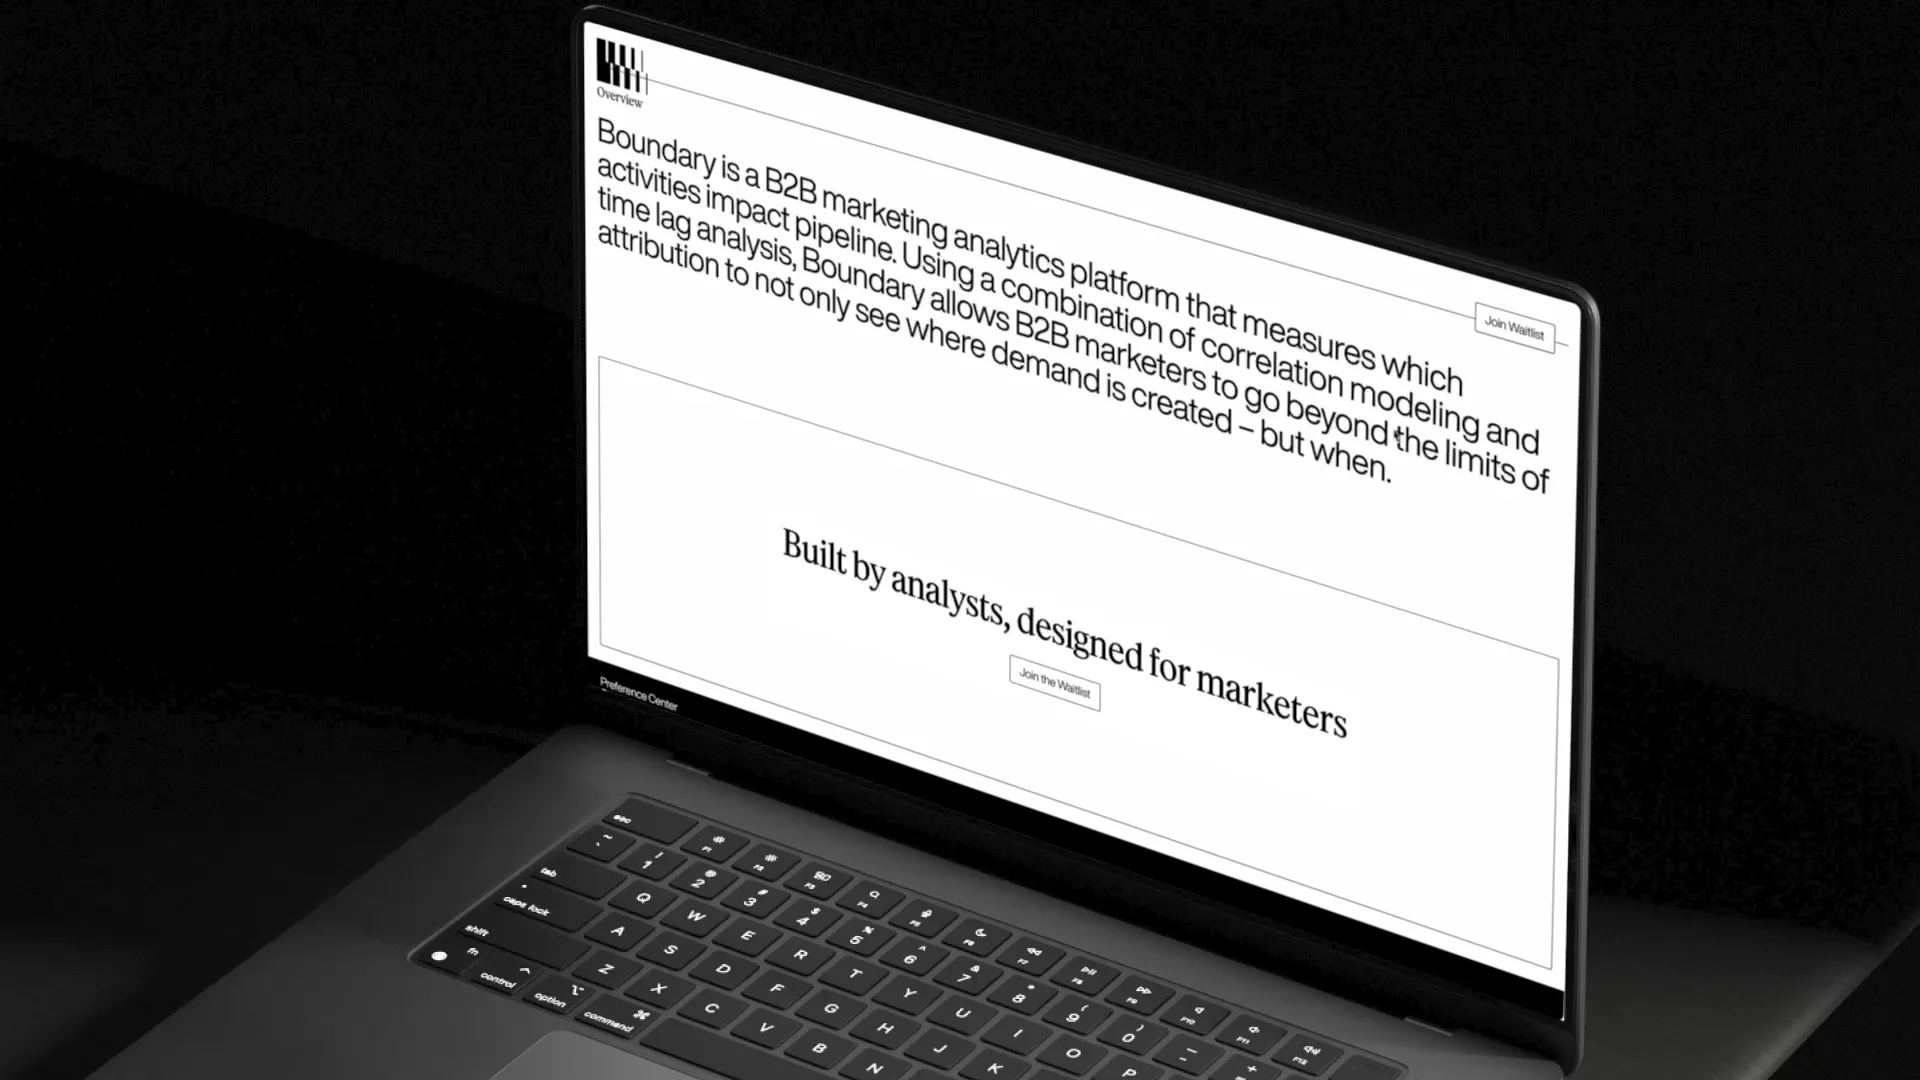
Boundary Analytics is a B2B marketing analytics platform that employs a groundbreaking method combining correlation modeling and time lag analysis to measure which activities impact pipeline. When the Boundary team first approached Cotton, three things were abundantly clear about the identity. First, it was clear that the team deeply believes in the explanatory power of data, and as such, that the identity needed to highlight this belief. Second, it was apparent that the product has rare potential to close the gap between marketers and analysts, based on co-founder Jeff Sirkin's years of experience in both industries. In an early interview, Sirkin said, “There’s a disconnect between marketers and analysts, and I speak both languages. It’s a problem marketers have been trying to crack for many years... and we really have something.”
Last but not least, it was pertinent to stand out. “The approach we're using isn't new, it's just never been applied in this context before,” co-founder Victoria Gamlen said, “So what we're really selling is a mindset shift. And we wanted our branding to reflect that – a deviation from what people are used to in SaaS branding while still staying true to what we do.” For Boundary, it was crucial not to look like just another software company—because they simply aren’t just another software company.
Concept
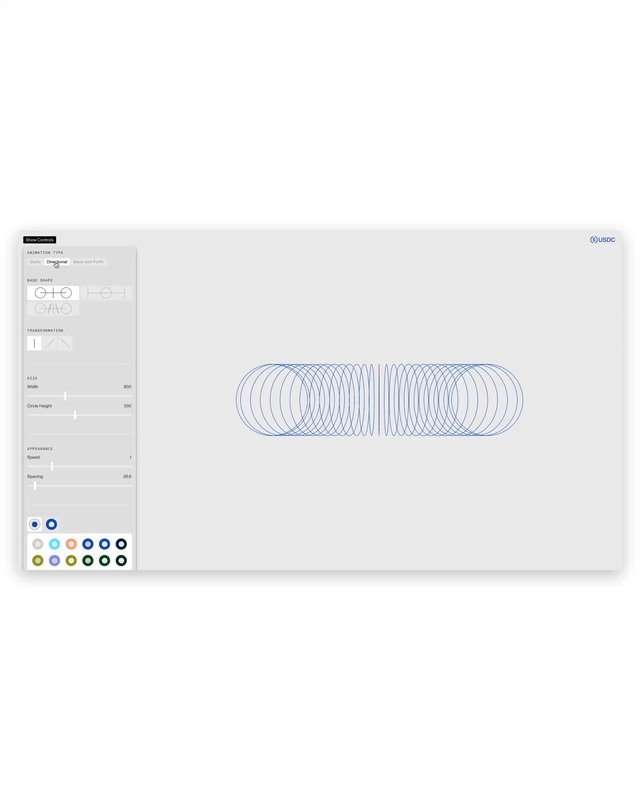
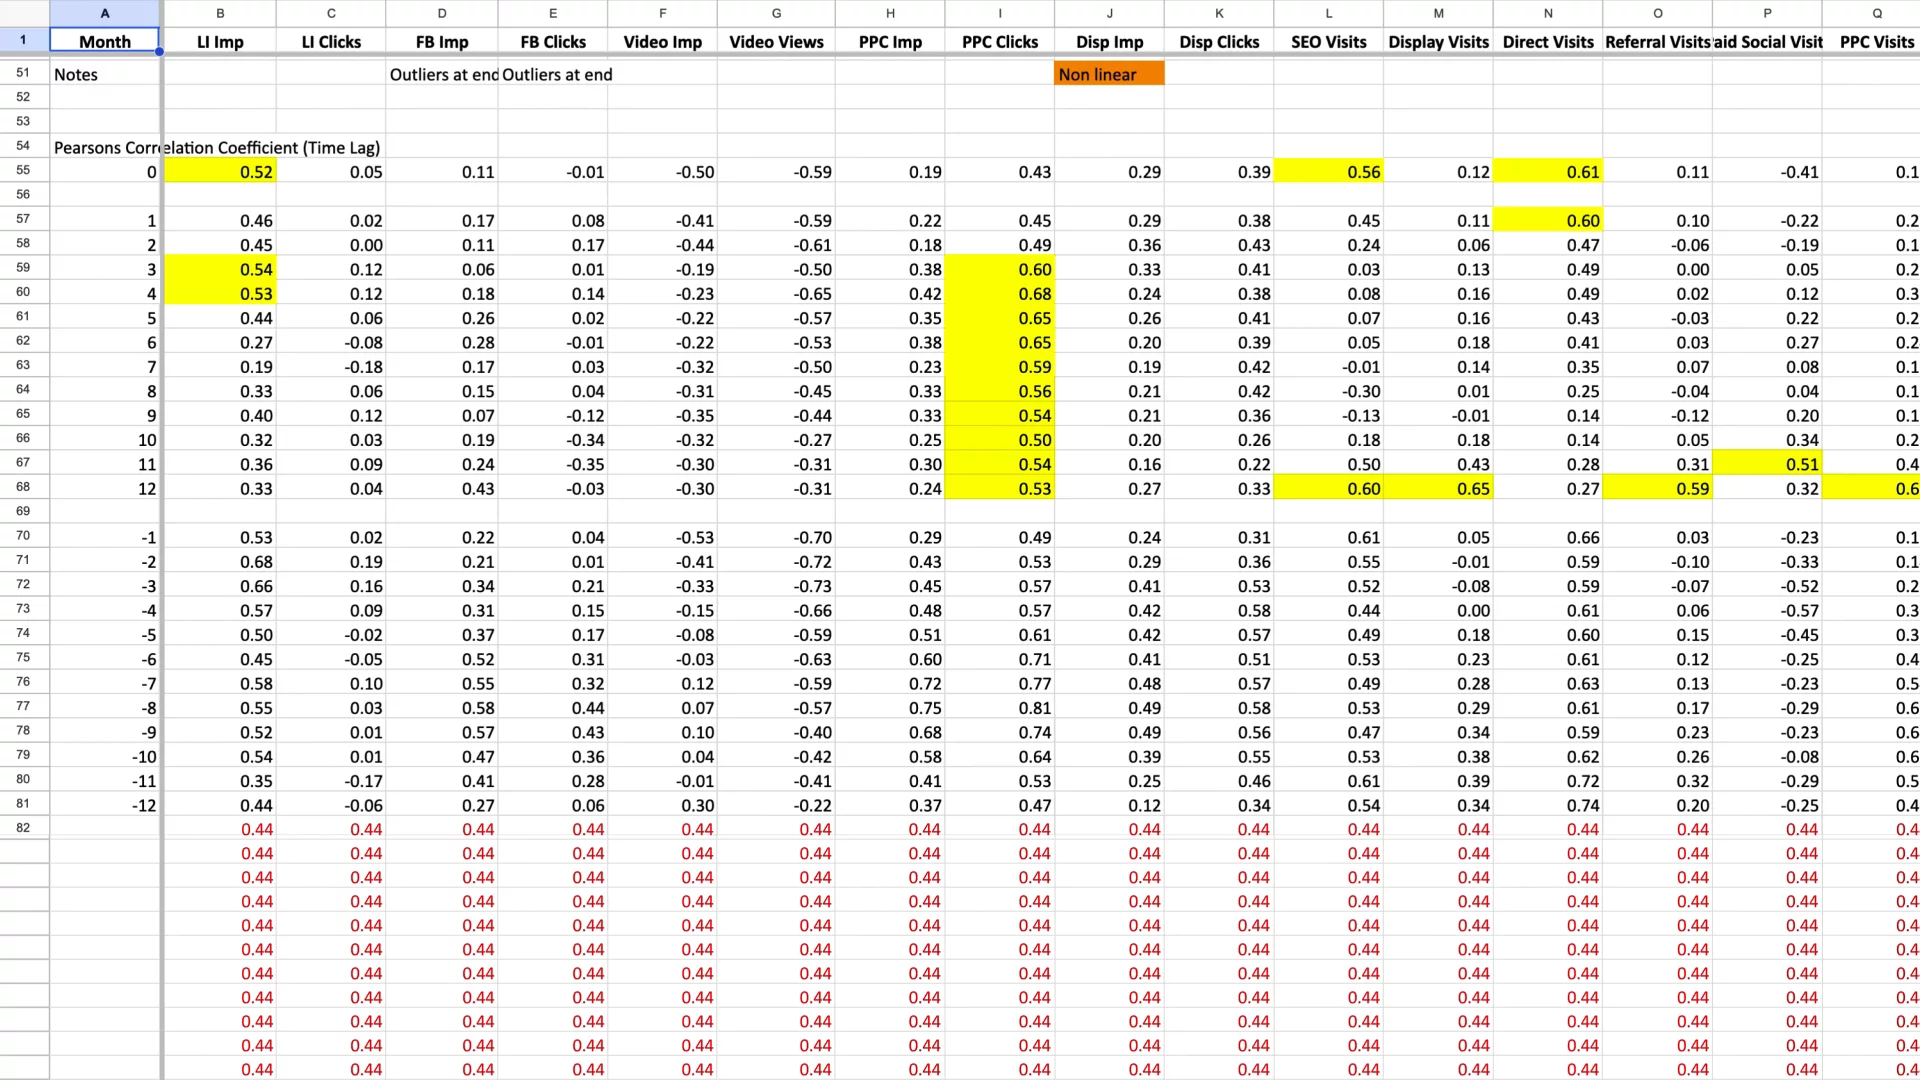
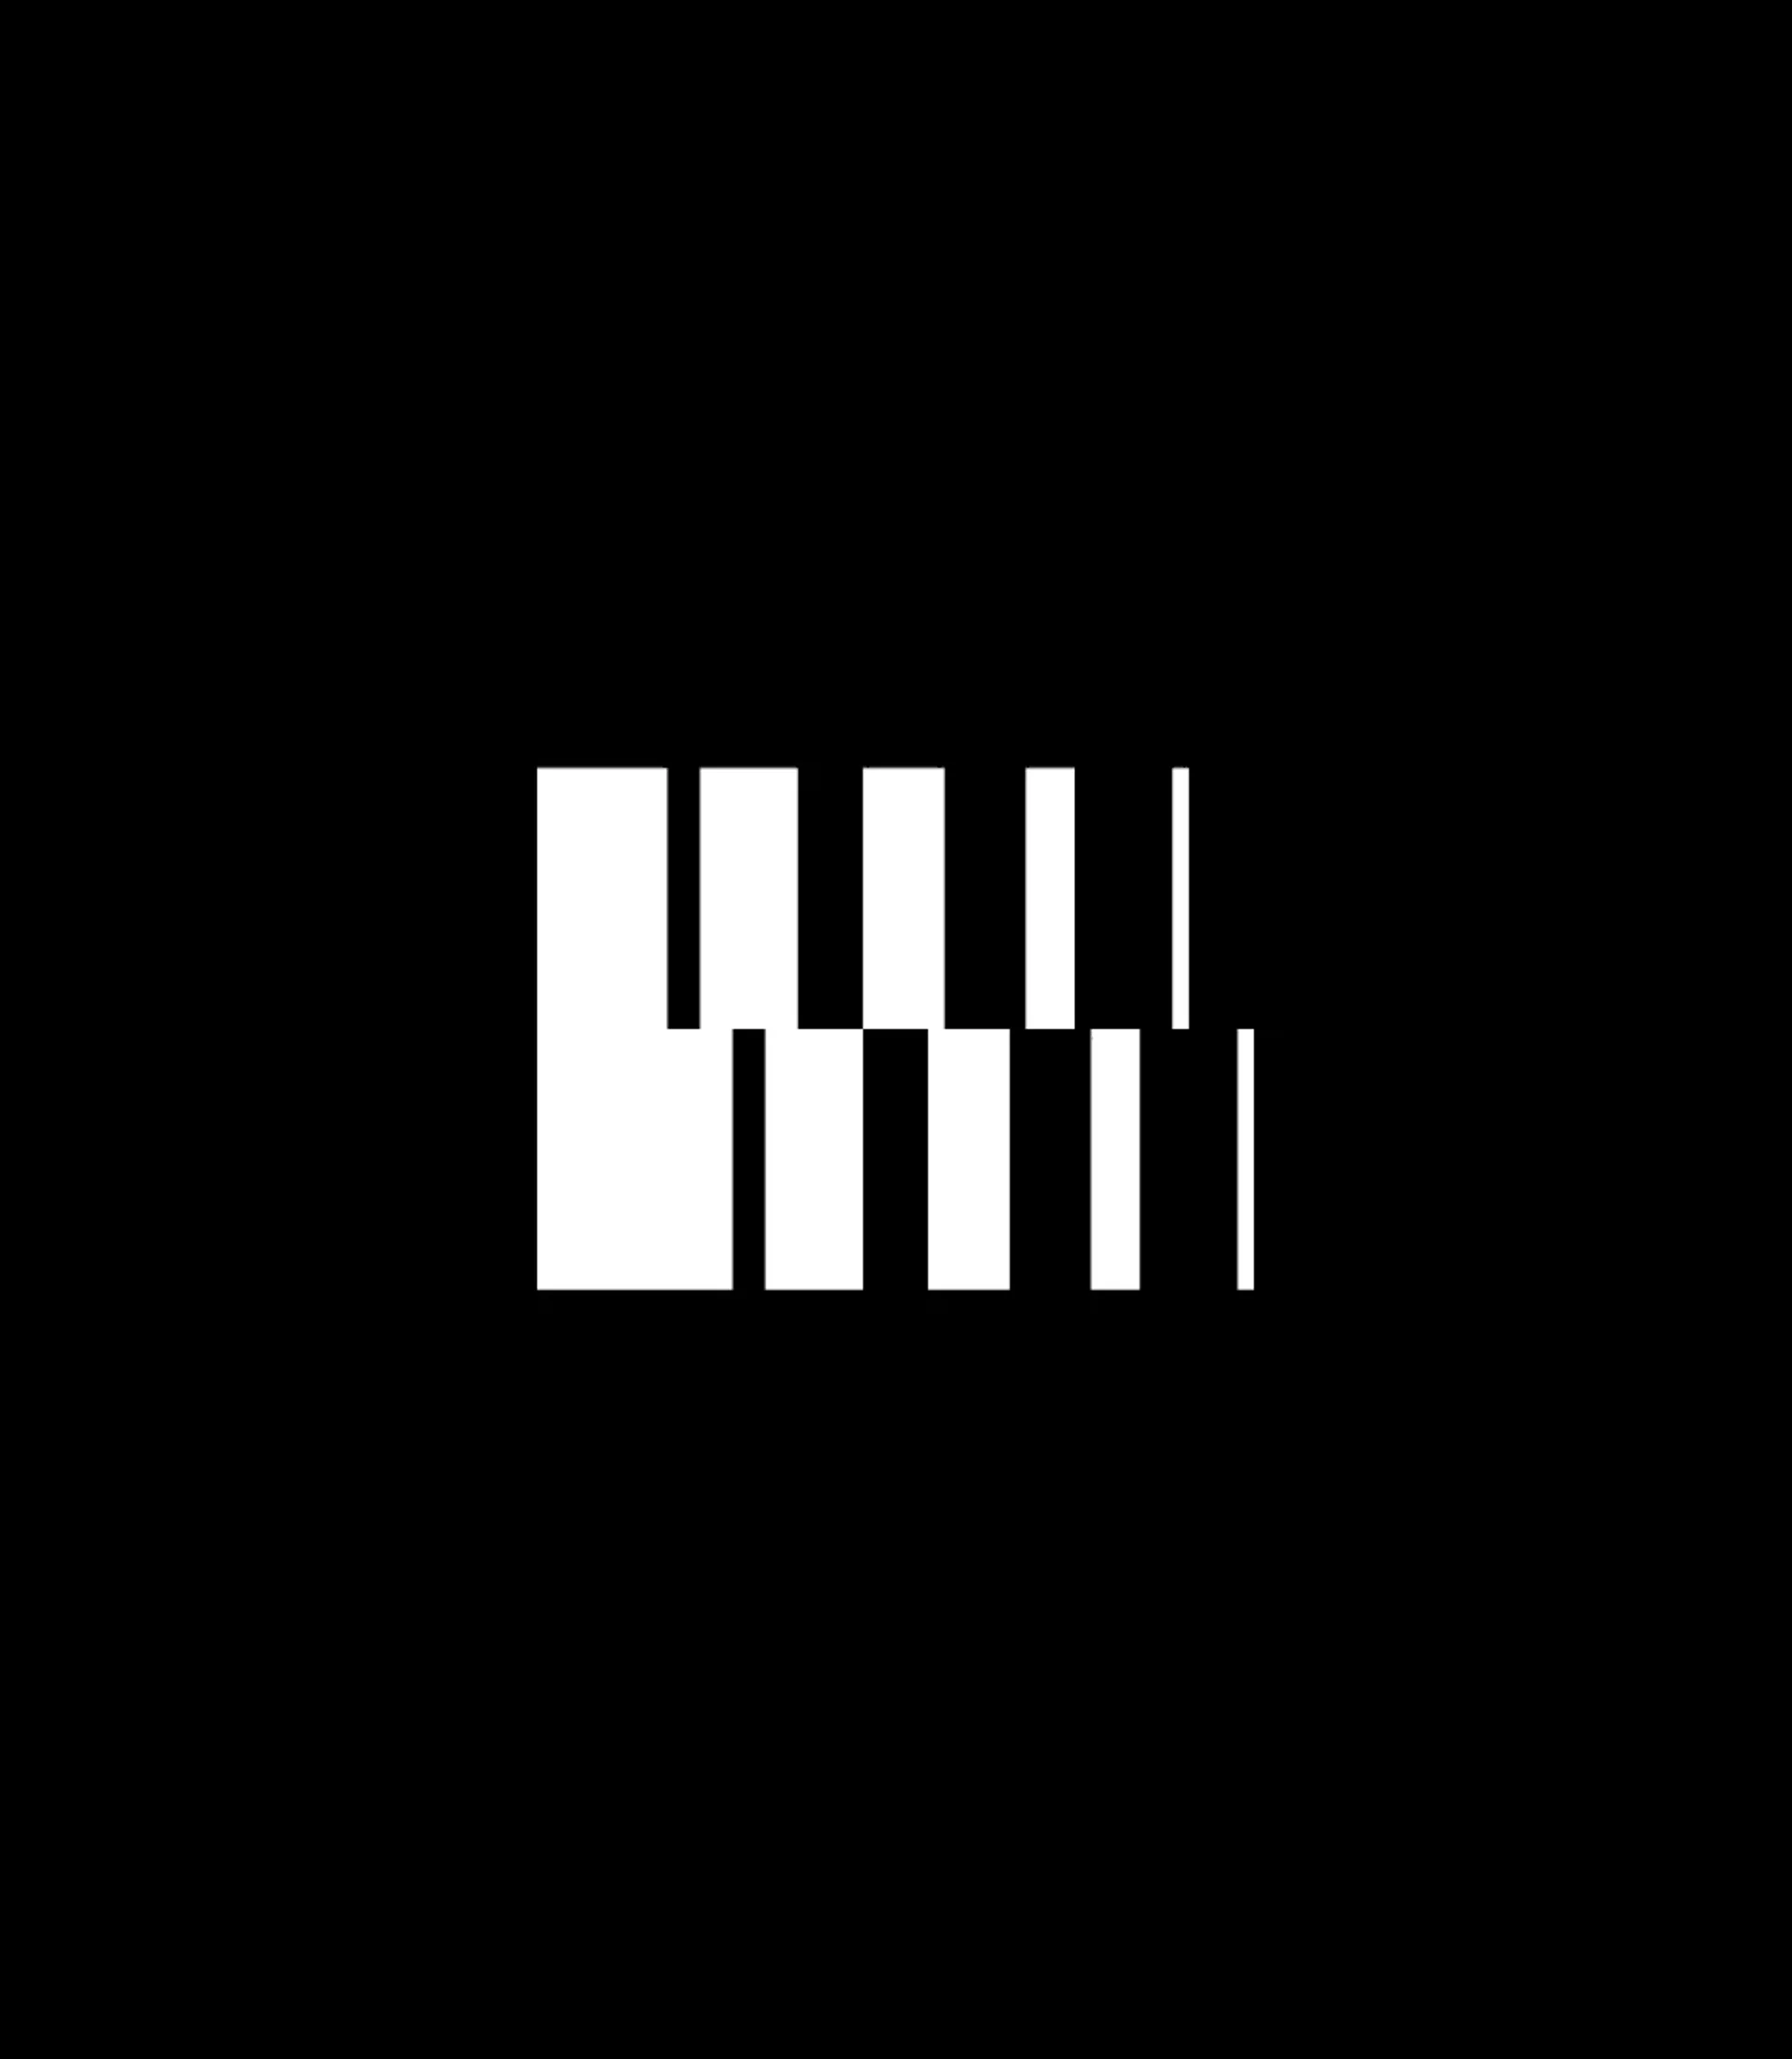
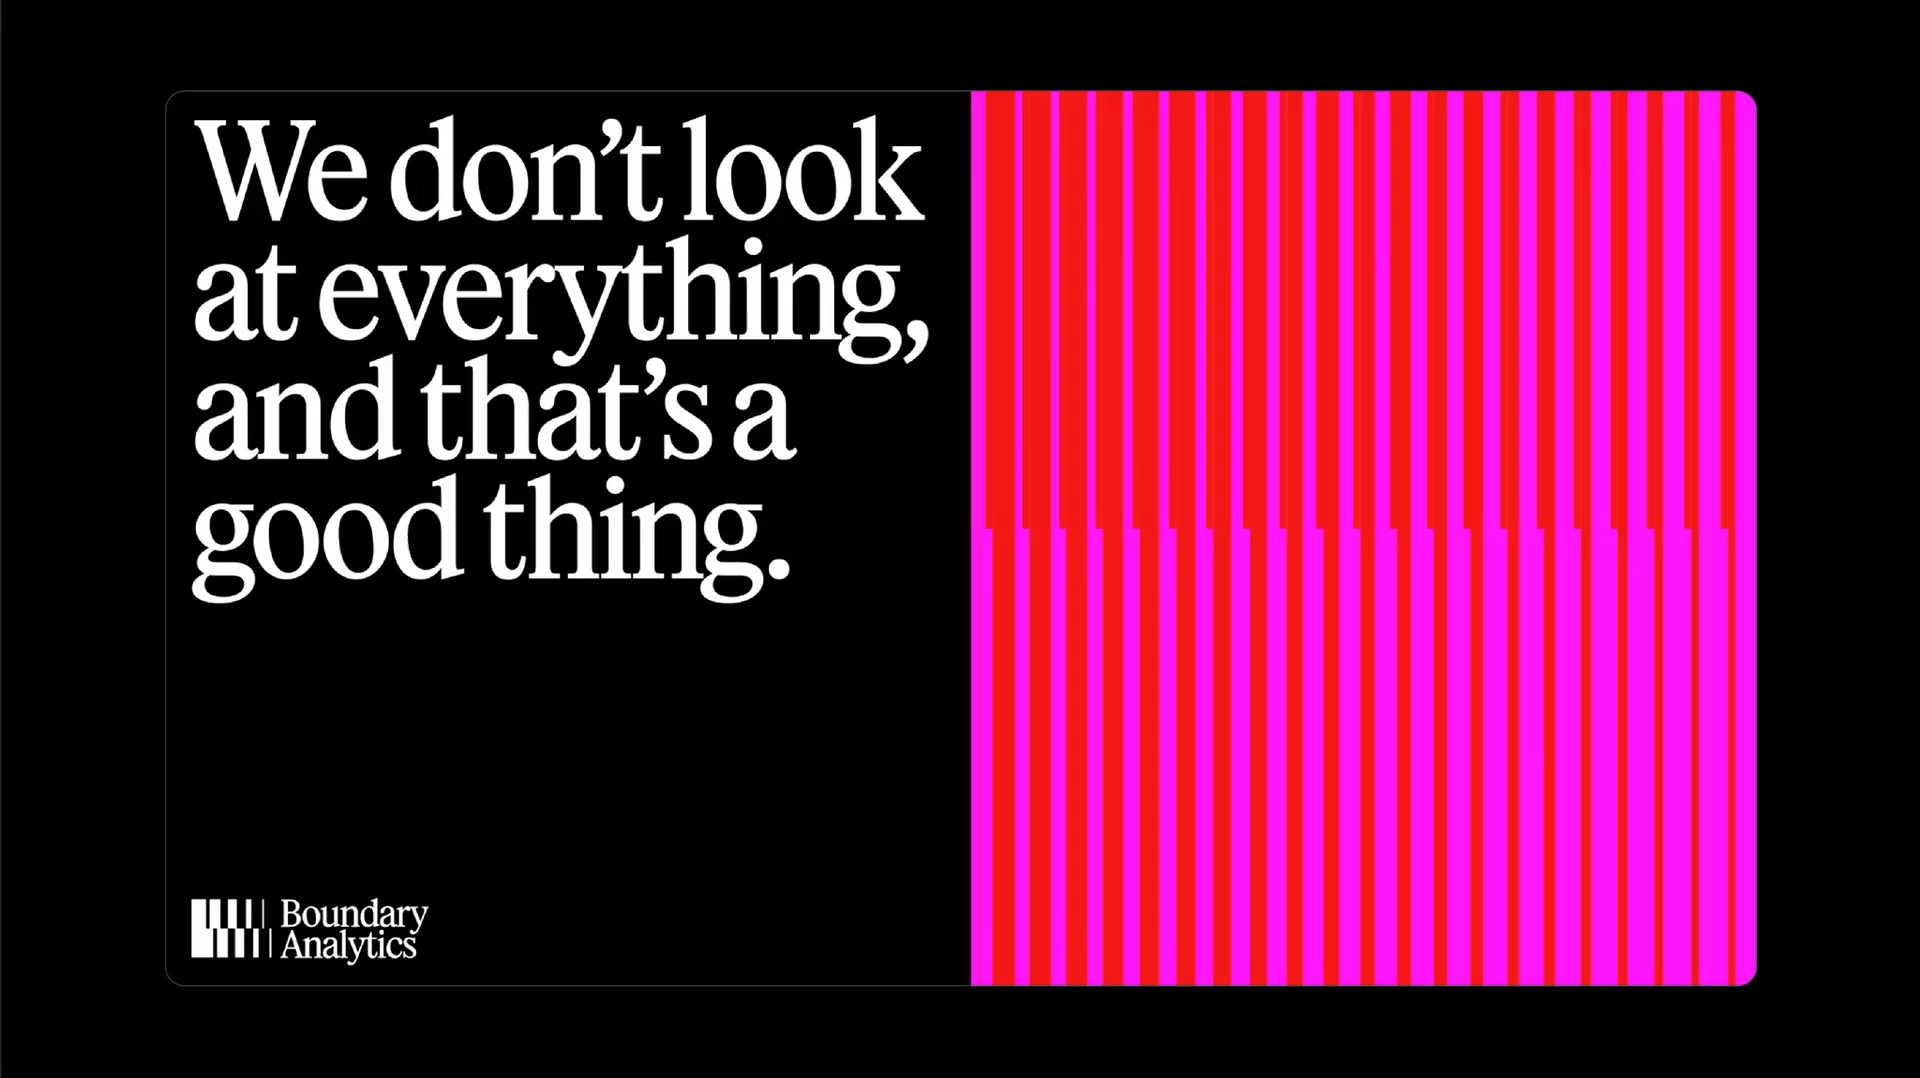
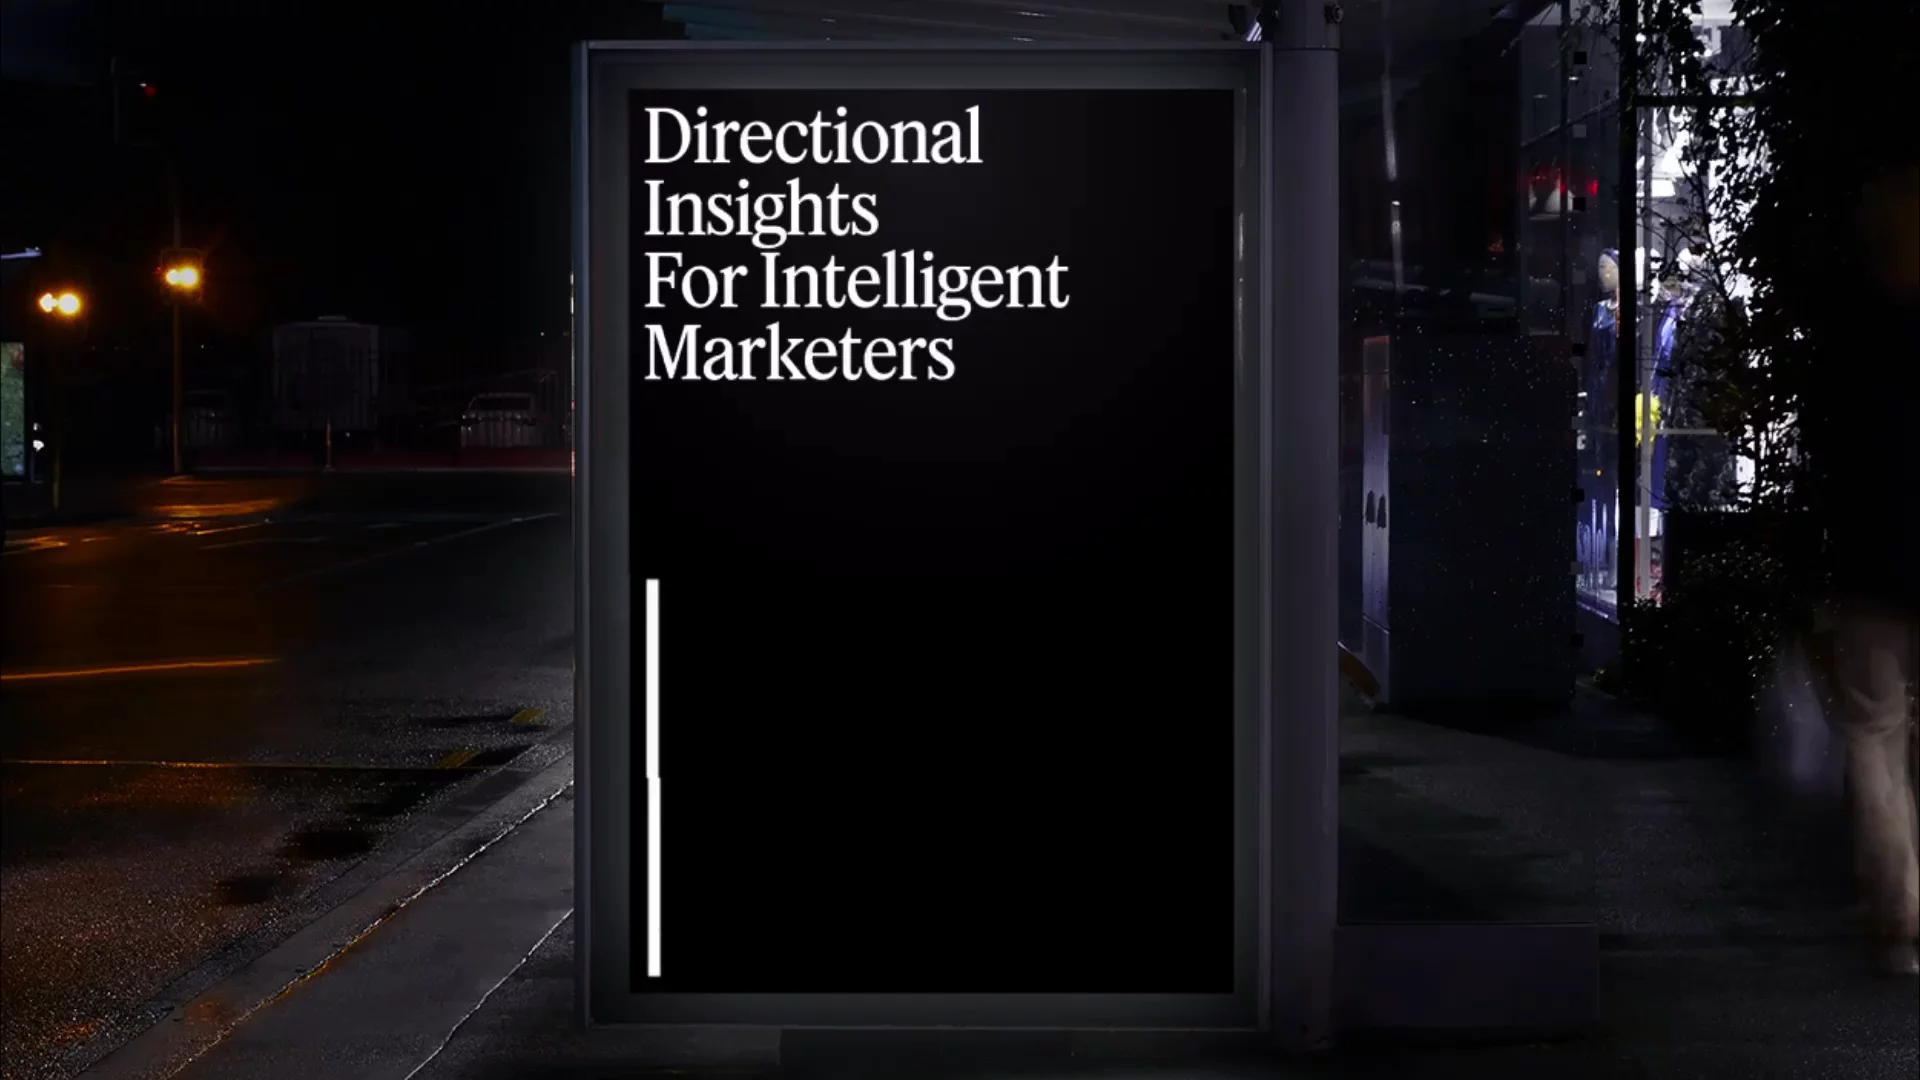
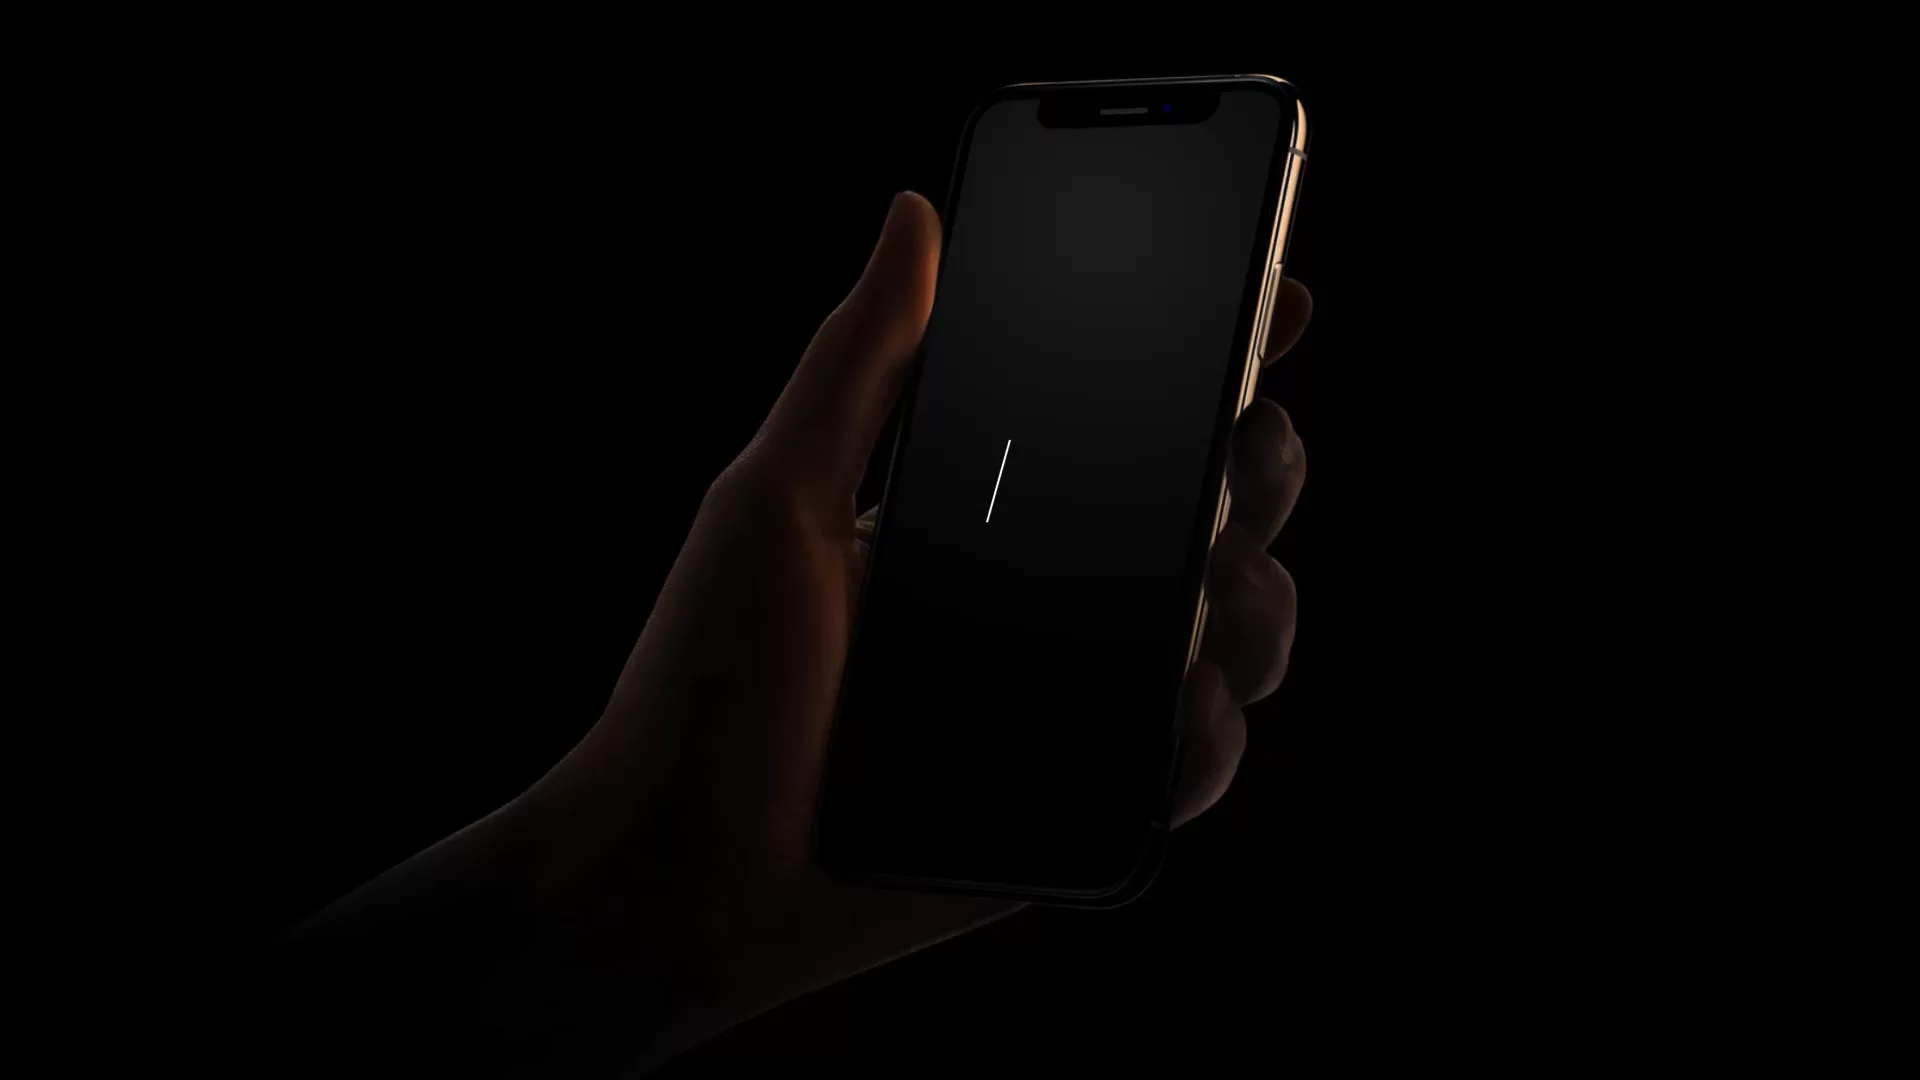
When they started, the initial proof-of-concept prototype of the product was simply... a spreadsheet. Well, it was a smart set of custom algorithmic methods that translated spreadsheet data into insight. But in turn, the visual identity is based on a visual motif that takes spreadsheet data and insight turns it into a numbers-based pattern. Each numerical value is simply represented by the width of a line. Applied both one dimensionally and two dimensionally, the result is a rhythmic texture that abstractly represents the ebbs and flows of numbers and data over time.


Wordmark
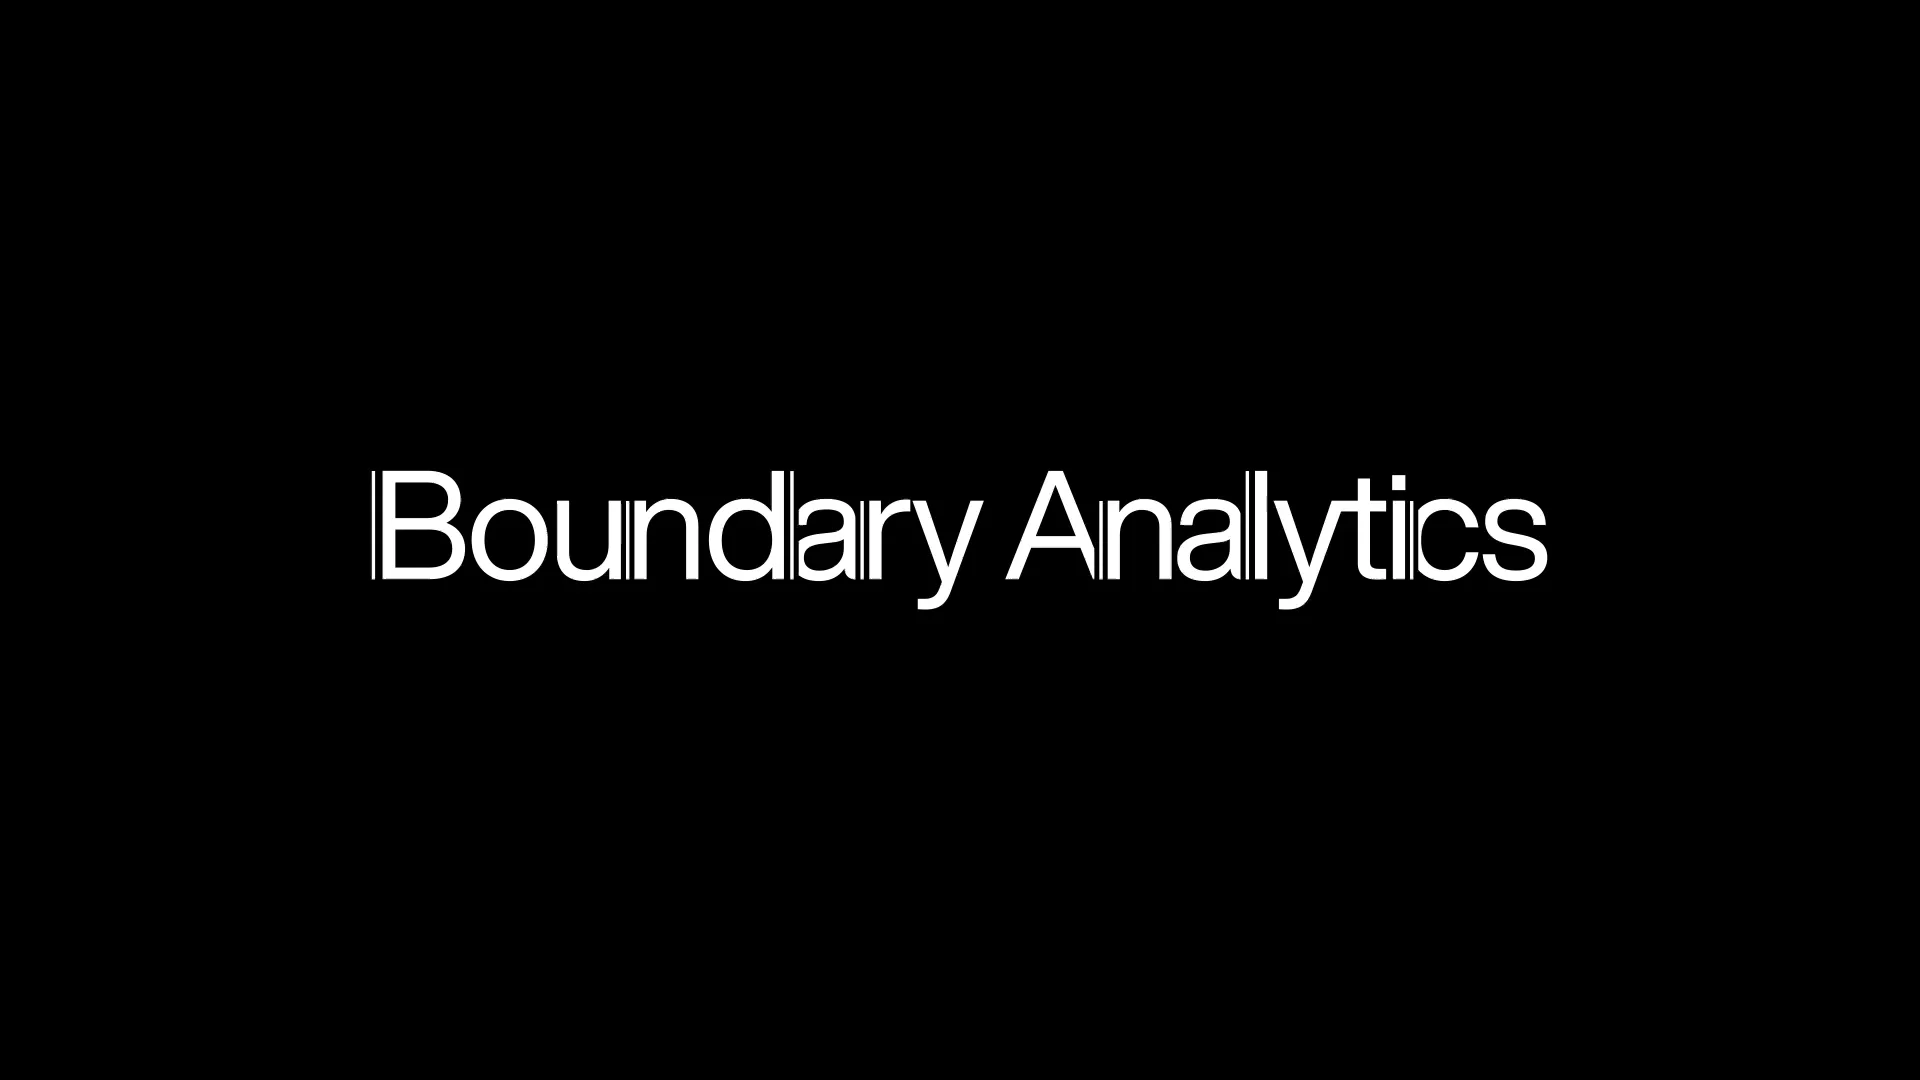
A secondary wordmark was developed to extend the system, fitting in locations where the primary lockup does not. The wordmark expands and contracts, representing Boundary's flexibility to accommodate a variety of datasets.


System
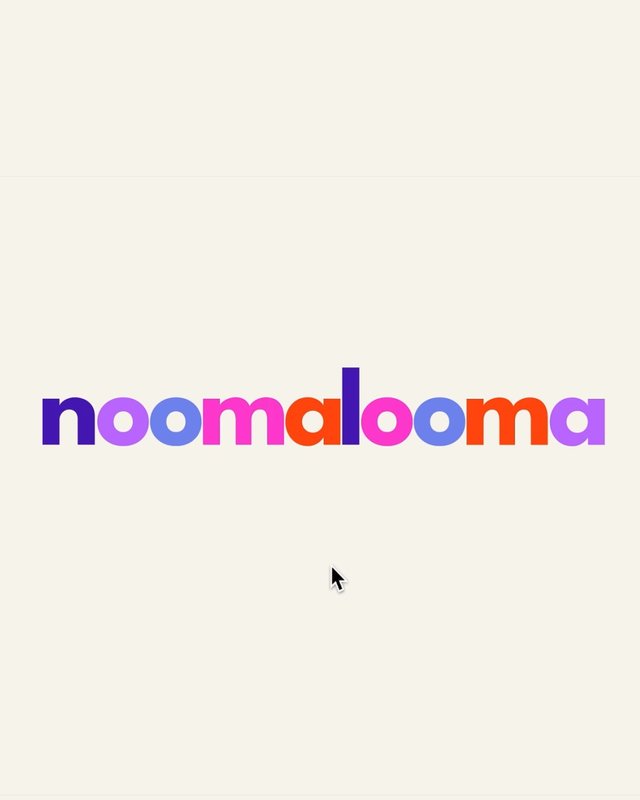
Color and typography were key pieces in making the brand stand out in a sea of “Saas Sans” and “B2B Blue”. A vibrant, digital color palette speaks to the brand's versatility, paired with headlines set in Commercial Type's stylish-by-design Feature Text to speak to creative audiences. Color is applied to a kit of generative patterns that reflect the numerical values on the spreadsheet.


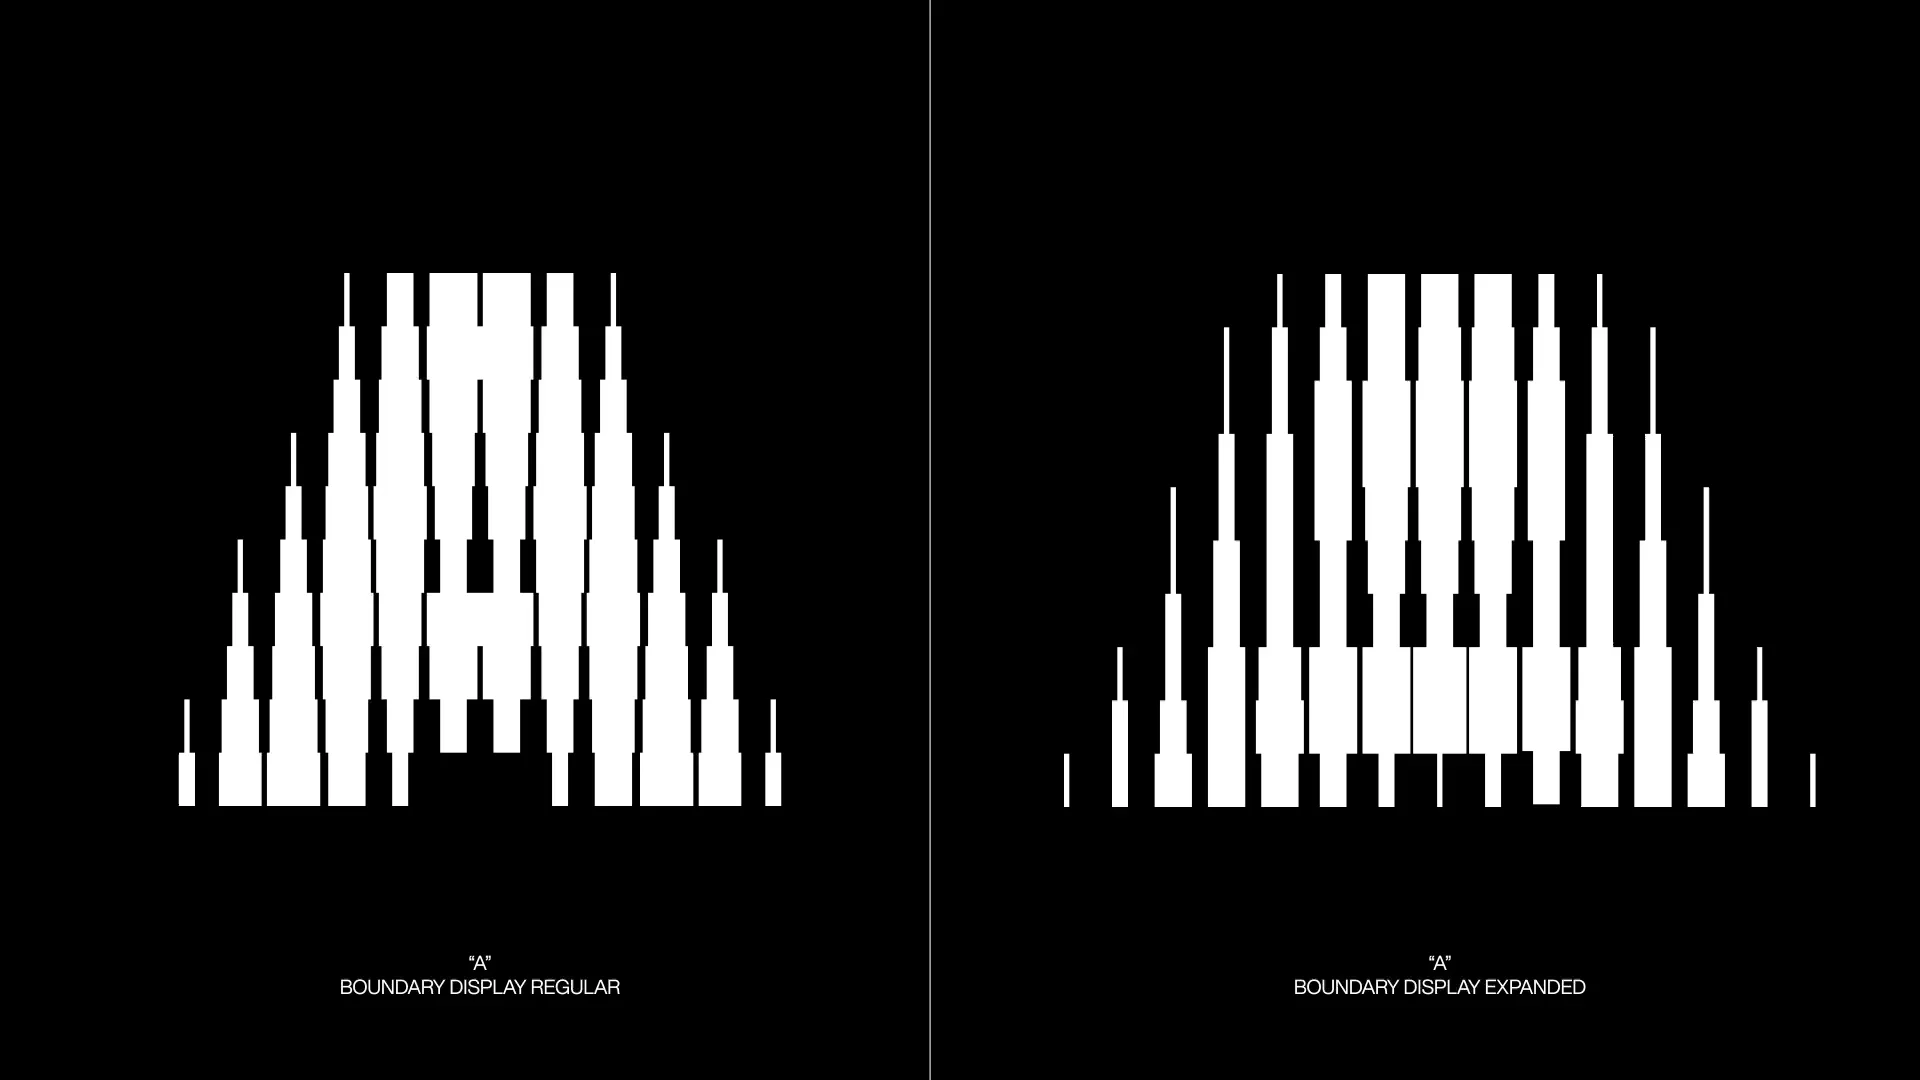
Custom Display Typeface
Boundary Display is a custom display typeface in two widths—Regular and Expanded—developed to continue the data-inspired patterned motif. With it, Boundary's small design team can easily make any typographic application more visually striking.


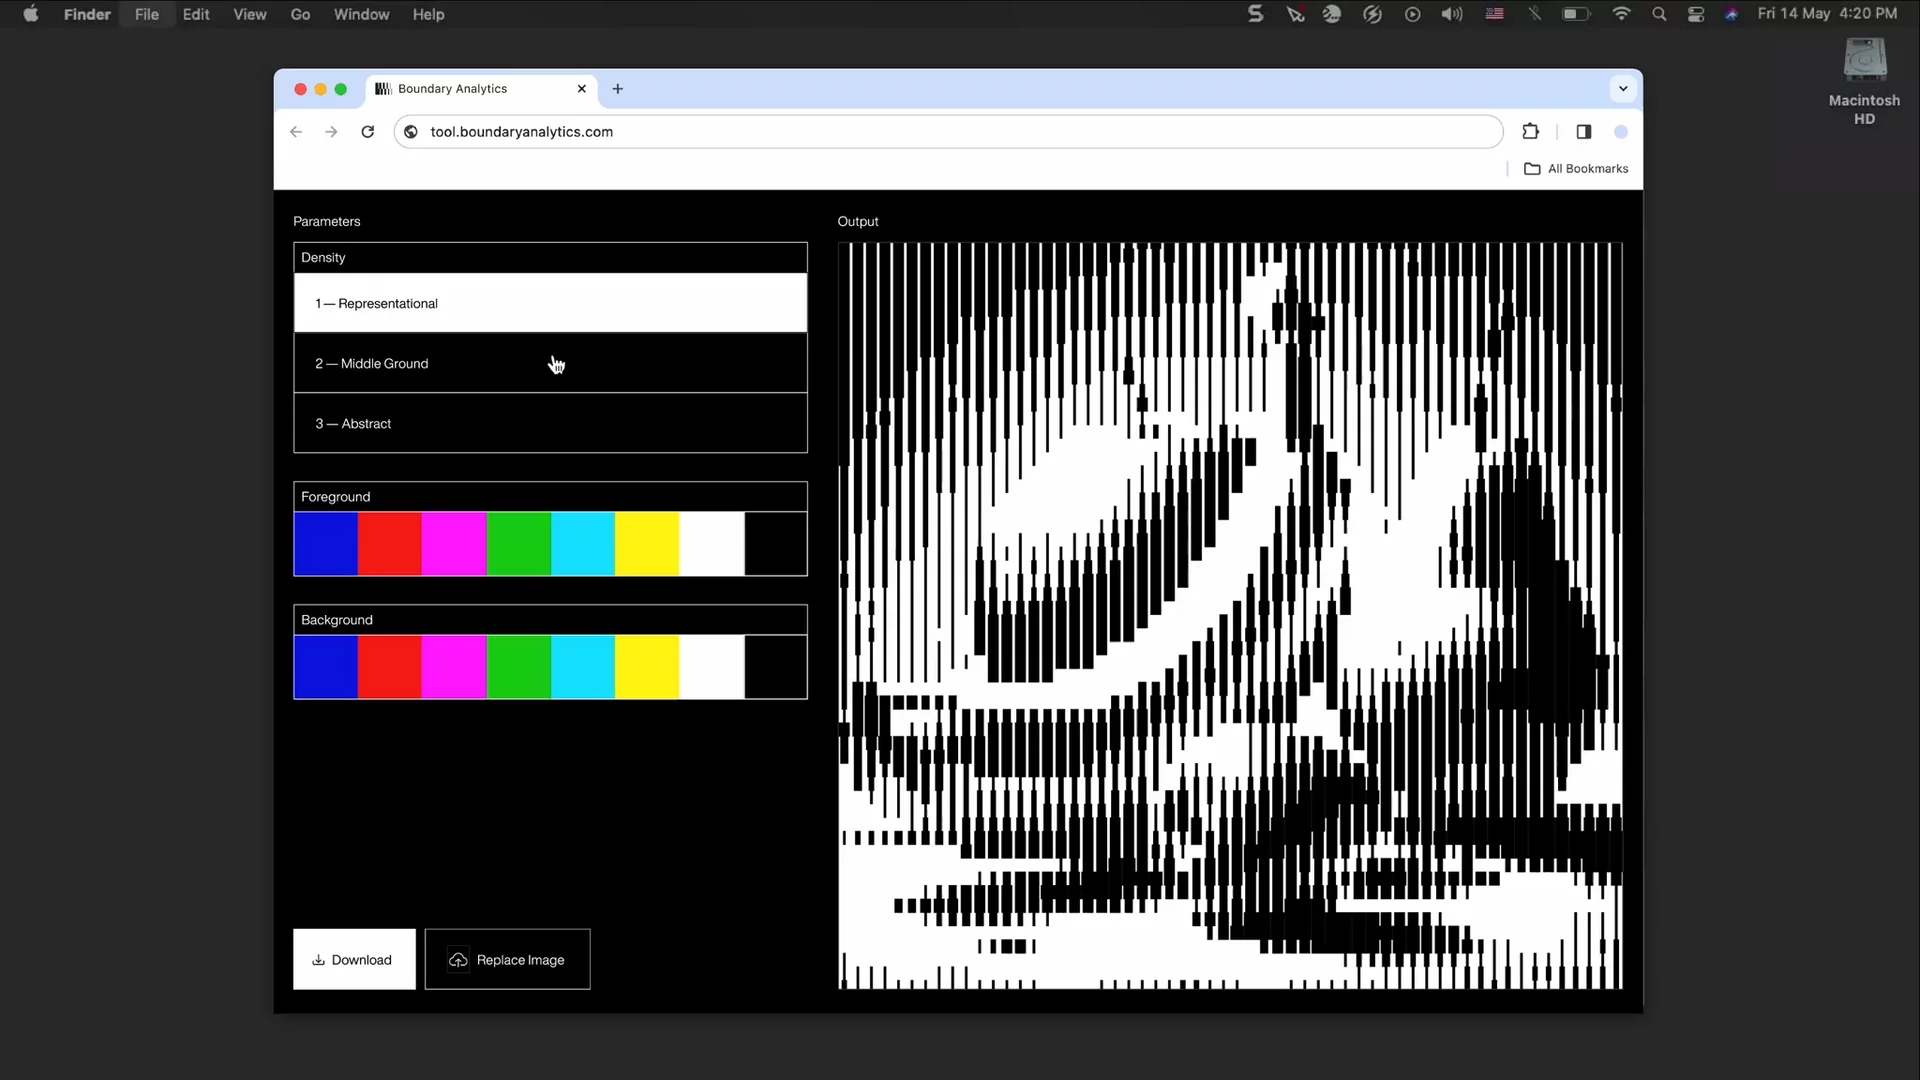
Generator Tool
A custom graphics generator creates on-brand accent images and textures. The user uploads any input image, chooses between three levels of abstraction, chooses two colors from the brand palette for the foreground and background, and downloads the custom created imagery to apply it on any graphic application as needed. With three levels of abstraction, the images can be representational or more abstract. Zooming into any image can also provide another method to creating abstract patterns.


Grid System
Between the expressive palette of patterns, display typography, and abstract images, the identity relies on a rigid, modular grid system to contain each element of each application. With it, a versatile range of consistent applications can be created.

Applications
The system & corresponding elements are designed to create a versatile output of graphics.


Project Team
- Talia CottonCreative Director
- Noah SchwadronLead Designer & Coder
- Chris KimMotion
- Sewon BaeProject Manager